|
Intermix.org.uk is a website for the benefit
of mixed-race families, individuals and anyone who feels they have a multiracial
identity and want to join us. Our mission is to offer a view of the mixed-race experience, highlighting icons, film, books, poetry, parenting techniques, celebrities, real lives and much more. Our online forums are a great place to meet others, ask questions, voice your opinions and keep in touch. Sign up for our monthly newsletter and delve into our pages. Want to join in? Become an Intermix member to take part: |
Statistics - The Census Question
Charlie Owen

The first time an ethnic question was included in a British census was in 1991. Extensive testing of a possible ethnic question had been conducted. Some tested versions included an option of ticking more than one category, but multi-ticking was found to be unreliable. (1) Other versions included a separate category of 'mixed', but this too was rejected, despite the successful inclusion of such a category in the ethnic question for the Labour Force Survey (LFS) since its inception in 1973. The Office for Population Censuses and Surveys (OPCS) acknowledged the success of the LFS question, with a single 'mixed' category, but chose a different strategy; the wording that was adopted for the 1991 census was:
If the person is descended from more than one ethnic or racial group, please tick the group to which the person considers he/she belongs, or tick the 'Any other ethnic group' box and describe the person's ancestry in the space provided.
So there was no specific category of 'mixed' to tick. Instead people who wanted to identify as 'mixed' were encouraged to choose a single category, or failing that to write a description. OPCS coders were given detailed instructions on how to code these written answers, including three mixed categories: 'Black/White', 'Asian/White' and 'Other Mixed'. (2)
There was considerable dissatisfaction with the quality of the data on the mixed populations from the 1991 census. It was widely believed to be a significant undercount, because there was no category of 'mixed' and the instructions encouraged people who wanted to identify as mixed to tick just one box. There is some direct evidence for the census giving an undercount: prior to 1991 the LFS ethnic question included a specific category of mixed, so people could choose that directly. Averaged over the three years prior to 1991, the LFS estimate was that all mixed groups combined formed 0.52 per cent of the total population, compared to an estimate of 0.42 per cent derived from the census.(3)
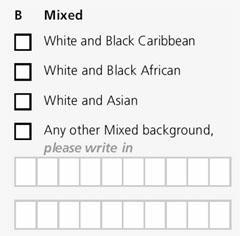 Partly as a result of the problems with the 1991 counts for mixed, partly in recognition growing demographic significance of the mixed population, and also partly in recognition of the wish of many people from mixed backgrounds to be able to identify themselves as such, it was agreed that explicit categories of 'mixed' would be included in the ethnic question on the 2001 census. (4) The final wording for the census in England and Wales included the question shown right.
Census results
The 2001 census estimated that in the United Kingdom, there were 677,000 people who identified as 'mixed' by choosing one of the mixed categories for the ethnic question. In percentage terms, the mixed population in the United Kingdom constituted 1.2 per cent of the total population of 58.8 million, but 14.6 per cent of the minority ethnic population. More detail is available for England and Wales than for the rest of the United Kingdom: the question in England and Wales had four mixed categories but Scotland and Northern Ireland each had only a single mixed category. Further results below are just for England and Wales.
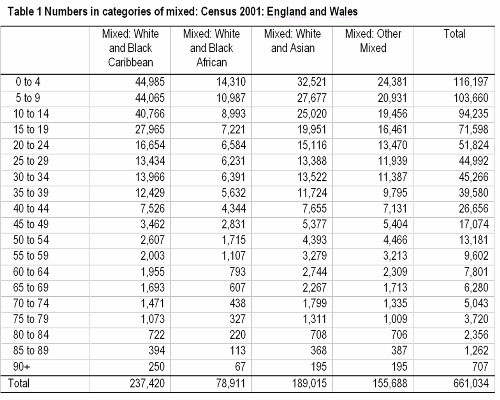
A detailed age breakdown, into 5-year age bands is shown in Table 1 (above). Looking at the totals, it is clear that the largest of the mixed groups was the 'White and Black Caribbean' group. They numbered 237,000, or 35.9 per cent of all people who identified as mixed. Next was 'White and Asian' at 189,000 or 28.6 per cent of all mixed. 'White and Black African' were 79,000 or 11.9 per cent. The final group of 'Other Mixed' was larger, at 156,000 (23.6 per cent). People who ticked the 'Any other mixed background' category were asked to give further details. The Office for National Statistics has published an analysis of these written answers. (5) This showed that the most common written description was 'Chinese and White' (10 per cent of the 'Other Mixed' answers); the next was 'Black and White' (7 per cent), then 'Black and Asian' (4 per cent).
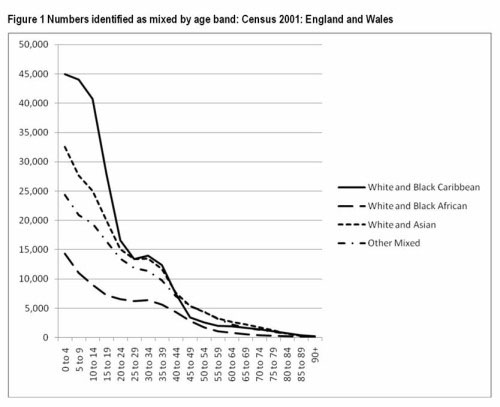
The data in Table 1 are also shown in Figure 1 (above). This shows that the numbers are much higher among the younger age groups.
This is shown more clearly in Table 2 (below), which shows, within each of mixed categories, the percentage of the group in each age band.
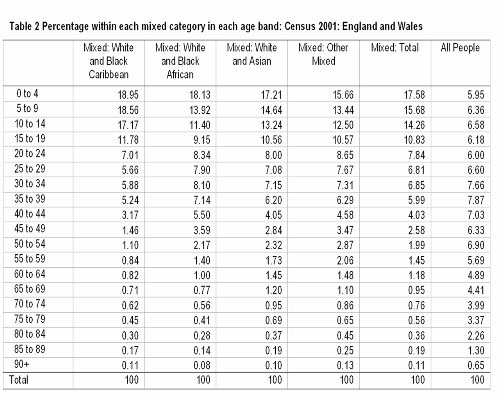
Taking the total mixed population, over 17 per cent were children aged under 5: this percentage was slightly higher for the 'White and Black Caribbean' group (18.95 per cent) and the 'White and Black African' group (18.13 per cent). This compares with just 5.95 per cent in this age band for all people (the final column of the table). In fact, the percentages in each 5-year age band are fairly consistent in this column, at around six to seven percent. The pattern for each of the mixed groups is quite different: they all show much higher percentages amongst children and young people. Indeed, almost half (47.52 per cent) of the mixed population were children aged under 15, whereas for all people the corresponding percentage was under one-fifth (18.89 per cent). The pattern is most extreme for the 'White and Black Caribbean' group, where more than half of the group were under 15 (54.68 per cent). At older ages the percentage for each of the mixed groups is much smaller.
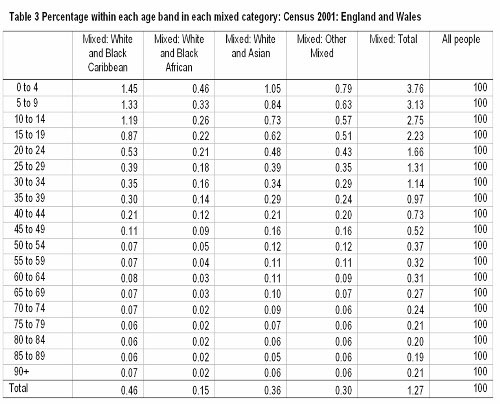
Another way of considering the data is in terms of what percentage of all people are in each mixed group. This is shown in Table 3 (above): although this looks like Table 2, in Table 3 the percentages within an age band sum to 100, whereas in Table 2 it is the percentages within each mixed group that sum to 100. Taking the total row, at the bottom of the table, it can be seen that 1.27 per cent of the total population in 2001 were classified, by their answers to the census question, as mixed. Of course, because of the young age profile of the mixed groups compared to the overall population, the percentage of the population who are mixed is higher at the younger ages. As can be seen in Table 3, almost 4 per cent of all under-5s in England and Wales in 2001 were mixed (3.76 per cent). This is still quite a small percentage. But remember, in the 2001 census, 91 per cent of the population in England and Wales were identified as 'white': the mixed group as a percentage of the minority ethnic population is much larger - 14.6 per cent; of the minority ethnic under-5 population, the mixed groups made up over a quarter (26.2 per cent).
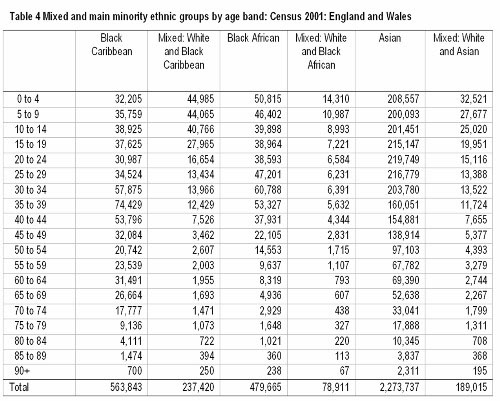
Table 4 (above) shows the numbers in three of the mixed groups alongside the ethnic group that is mixed with white in the 'mixed' category. So 'Black Caribbean'is next to 'Mixed: White and Black Caribbean'; 'Black African' is next to 'Mixed: White and Black African'; 'Asian' is next to 'Mixed: White and Asian' ('Asian' here is the sum of four columns in the main census tables: 'Indian', 'Pakistani', 'Bangladeshi' and ˜Other Asian').
The 'White and Asian' group is the smallest relative to the main Asian group, 8.31 per cent. The percentage is highest among the younger age groups, with the mixed group equal to 15.59 per cent of the Asian under-5 group. The 'Mixed: White and Black African' group is larger relative to the 'Black African' group: overall the percentage is 16.45. Like with the mixed white and Asian group, the numbers are higher for the younger ages: taking the youngest group, the under-5s, the mixed are equivalent to 28.16 per cent of the Black African group - more than a quarter.
Finally, to the 'Mixed: White and Black Caribbean' group as a percentage of the 'Black Caribbean' group. Overall the percentage is 42.11. However, the high percentage at the younger ages is even more pronounced here. Indeed, for each of the three age bands 0 to 4, 5 to 9 and 10 to 14 there were more children of mixed white and black Caribbean origin than of black Caribbean origin. Looked at another way, taking all children who had at least one black Caribbean parent, there were more where the second parent was white than where the second parent was also black Caribbean.
Conclusion
In the 2001 census, one and a quarter percent of all people in England and Wales were of mixed origin: one sixth of the minority ethnic population were of mixed origin. Almost four percent of all under-5s in England and Wales were of mixed origin: one quarter of the minority ethnic population of under-5s were of mixed origin. This is a huge demographic shift in the population. What is most striking is not just the growth of the mixed populations as a percentage of the total population - but as a percentage of the minority ethnic population.
This paper is taken with kind permission from the forthcoming Runnymede Trust publication: Mixed Heritage: Identity, Policy and Practice.
References
(1) Sillitoe (1978:17)
(2) Bulmer (1996)
(3) Phoenix & Owen (1996).
(4) See: Aspinall (1996)
(5) Bradford (2006)
Bibliography
Aspinall, P. J. (1996). The Development of an Ethnic Question for the 2001 Census: The findings of a consultation exercise of the 2001 Census Working Subgroup on the Ethnic Group Question. London: Office for National Statistics.
Bradford, B. (2006). Who are the 'Mixed' ethnic group? London: Office for National Statistics.
Bulmer, M. (1996). 'The ethnic group question in the 1991 Census of Population'. In: D. Coleman & J. Salt (Eds.), Ethnicity in the 1991 Census. Volume 1: Demographic characteristics of the ethnic minority populations. London: HMSO: 33-62.
Phoenix, A., & Owen, C. (1996). 'From miscegenation to hybridity: mixed relationships and mixed parentage in profile'. In: B. Bernstein & J. Brannen (Eds.), Children, Research and Policy. London: Taylor & Francis: 111-135.
Sillitoe, K. (1978). Ethnic Origins 1. An experiment in the use of a direct question about ethnicity, for the census (No. Occasional Paper 8). London: OPCS.